Spawn: A simple tool for generating realistic data
As part of my thesis requirement, I decided to research and implement a data genenerator. This post houses a current draft of my thesis report.
Abstract
Data generators are instrumental in any software testing and database benchmarking process. Developing data generators, however, is a complex task. While most developers have a conceptual understanding of their desired dataset, they face difficulty translating their conceptual understanding into the billion rows of test data that they are required to generate.
This paper presents a highly-extensible and modular data generation tool that simplifies the process of generating realistic test data. The tool also promotes code reuse, sharing and refinement through enforcing a consistent modular interface.
The tool abstracts generic/complex concerns - such as fast random number generation, and task scheduling - away from developers, enabling them to invest their efforts in declaring how their data should look like.
1. Introduction
Database benchmarks while robust are tested using stock schemas. Such benchmarks provide developers with a good estimate of their database system's general performance. They are, however, unable to provide developers with the following:
- Their database system's performance when tested using their own custom schemas.
- Their database system's performance when schema is normalized and denormalized.
- Realistic test data [FOOTNOTE: meaningful data with statistical properties that approximate a production environment] for backend stress testing.
- Realistic test data for usability acceptance testing.
Such highly-specific information can only be derived through developing custom data generators to populate the custom schema with realistic test data.
While there are many general-purpose data generators available in industry, their low degree of customizability do not allow developers to generate realistic datasets which often exibit rich intra-row[FOOTNOTE: data dependencies across a single row], intra-column[FOOTNOTE: data dependencies down a single column], and inter-table[FOOTNOTE: data dependencies across a foreign-key relation] correlations. As such, many developers resort to developing their custom data generators from scratch. These data generators, however, are often inflexible, tedious to produce, and difficult to reuse.
1.1 Claims & Contributions
This paper introduces Spawn, a highly-extensible and modular data generation tool developed in javascript. Spawn consists of:
- A core library that manages the complexities of generating realistic datasets.
- An extension suite that allows developers to extend Spawn with their own custom logic.
- A Graphical User Interface (GUI) that makes Spawn easier to use.
Spawn is based upon two fundamental structures:
- A modular architecture that demarcates a clear seperation of concerns between Spawn's core library and its extension suite.
- A graph model that enables Spawn to generate data with complex inter-row and intra-table relationships.
1.2 Outline
This paper first discusses related work in (Section 2), then articulates the desirable qualities of a data generator in (Section 3).
With those qualities articulated, the paper then:
- Provides a structural overview of Spawn's modular architecture in (Section 4)
- Introduces Spawn's graph model in (Section 5)
- Explains Spawn's graphic design principles in (Section 6)
- Summarizes how Spawn generates data quickly in (Section 7)
Finally, the paper will compare Spawn against other data generators based on three key criteria in (Section 8):
- Expressiveness
- Ease of configuration
- Speed
2. Related work
Since the development of DBGEN [FOOTNOTE - the first data generator developed by the Transaction Processing Performance Council (TPC)] in 1992, frameworks and techniques for generating data have been explored substantially across academia and industry.
2.1 Academic work
Significant research have been conducted on improving the speed of data generation. [Grey et al, 1994] presented a technique that allows for fast, parallel generation of data in linear time. The limitation with Grey's model is that the number of processors participating in the parallel data generation process is fixed from the start. [Rabl et at, 2010] solved this limitation by proposing a technique that allows for linear scaling for arbitrary number of processors.
Techniques for improving the expressiveness of data generators have also been expored. [Bruno & Chaudhari, 2005] presented a flexible and easy to use framework for data generation. Their research introduced a graph-based evaluation model which is capable of modelling data distributions with rich intra-row and inter-table correlations. [Houkjaer et al, 2006] also presented a similar graph-based model but diverges from Bruno & Chaudhari's model by allowing intra-column dependencies at the cost of enforcing sequential data generation.
2.2 Industry work
Industrial data generators fall into two categories: General and Specific. Specific data generators are designed to produce a predefined data set used for benchmarking purposes. General data generators on the other hand offer developers the ability to customize the data they need.
2.2.1 Specific data generators
Most industial data generators fall into the specific category. Notable generators include DBGEN for TPC-H benchmarking [Poess & Floyd, 2000] and MUDD for TPC-DS benchmarking [Stephens & Poess, 2004].
While specific data generators are usually extremely fast and highly-expressive, they can only generate a predefined data set which makes it unsuitable for usability testing and backend stress testing purposes. Both testing paradigms require data generated specifically for the software being tested.
2.2.2 General data generators
General data generators on the other hand suffer from the opposite problem. They offer developers with a fair degree of customizability but sacrifice expressiveness and speed.
At the time of writing this paper, the five most popular general data generators available - Mockaroo, FDG, DTM, Red Gate, and Generate Data - were analysed for their capabilities.
Mockaroo, FDG, and Generate Data offer great row-wide data generators with results of high variability. They also allow data to be exported in multiple formats, such as CSV, JSON, XML, and SQL.
However, they do not allow developers to insert their own custom logic, or perform seeded data generation.
Red Gate and DTM, on the other hand, offers seeded data generation, and the ability to insert custom logic.
They, however, comes at a price of $369 and $149 per license respectively.
While all of the above-mentioned general data generators offer intra-row data dependencies, none of them allow for intra-column or inter-table data dependencies. They also do not afford parallel data generation.
3. Desirable qualities
In this section we examine some of the qualities that users of data generators are likely to desire. We define two categories by which we analyze the qualities of data generators.
The first category is concerned with how users want their data generators to perform. We define this category as performance qualities (Section 3.1) and it encompasses qualities such as:
- (Section 3.1.1) Statistically representative data
- (Section 3.1.2) Repeatable data generation
- (Section 3.1.3) Time and space performance
- (Section 3.1.4) Parallel data generation
- (Section 3.1.5) High data generation periodicity
The second category is concerned with how users want to develop on their data generators. We define this category as development qualities (Section 3.2) and it encompasses qualities such as:
- (Section 3.2.1) Code reusability (Reuse components for diff needs)
- (Section 3.2.2) Ease of configurability
- (Section 3.2.3) Declarative and functional style programming
IN INTEREST OF COMPLETING THIS DRAFT THIS SECTION IS TRUNCATED
4. Spawn: Architecture
Spawn has a simple architecture that consists of a core and an extension suite. This section will first demonstrate how the Spawn Extension Suite allows developers to extend Spawn using their own custom logic before articulating how Spawn Core orchestrates the data generation process.
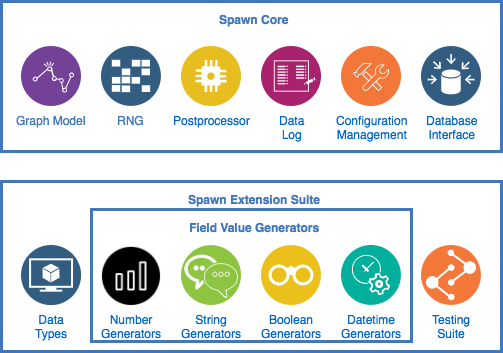
4.1 Spawn Extension Suite
Spawn Extension Suite provides all the tools required to make extending Spawn as simple as possible.
4.1.1 Data Types
The Data Types component outlines the Spawn type system and provides an ubiquitous Type Checking mechanism for all Spawn extensions.
All extensions developed in Spawn are required to implement the types defined by the Data Types component.
4.1.2 Field Value Generators (FVG)
While Data Types and Testing Suite are supporting tools developed to make extending Spawn as simple as possible, FVGs are the actual extensions that developers develop for Spawn.
FVGs are categorized by their output type:
- Number generators generate numbers.
- String generators generate strings.
- Boolean generators generate booleans.
- Datetime generators generate datetime.
With the exception of Datetime generators which are often required to generate datetimes based on the current time, Spawn enforces that all FVGs are pure functions for the following reasons:
- The RNG in Spawn Core abstracts the task of generating fast and repeatable randomness away, allowing FVGs to generate random data while staying pure.
- Pure functions have more predictable behavior.
- Pure functions are easier for developers to reason about.
- Prevent developers from implementing their own random number generators which are prone to errors, poor performance, or poor statistical properties.
- Allows Spawn to generate identical data across multiple runs.
FVGs have access to the following inputs:
rn- a random floating point number uniformly distributed in the range of [0,1).id- the row id of the field being generated.-
lastN- the list of fields generated by the FVG with ids in the range of[id - N, id - 1].Ncan be specified by the FVG's developer.lastNallows developers to generate data with intra-column data dependencies.
-
rowData- Given that the current FVG generates data for columnx,rowDatais the list fields generated in the same row from columns[1, x - 1].rowDataallows developers to generate data with intra-row data dependencies.
-
foreignData- Given that the current row (R1) being generated is associated with another row (R2) through a foreign key,foreignDataprovides R1 with access to the list of all values generated in R2 provided that R2 has already been generated.foreignDataallows developers to generate data with intra-table data dependencies.
userParameters- FVGs may optionally require user-provided parameters to generate data. eg. a number generator that generates normal distributions will require that users provide the mean and standard deviation.
Spawn provides developers with a simple way to gather the data they require for generating realistic data. This structure makes developing FVGs a much simpler task in Spawn as compared to other data generation tools.
4.1.3 Testing Suite
This component provides an exhaustive list of tests to ensure that developed extensions are compliant with Spawn's requirements. Extensions that pass the tests defined in the testing suite are guaranteed to function properly within Spawn.
The testing suite provide developers with the ability to check for their extension's compliance without loading it into the Spawn GUI. This substantially shortens development time, and is likely to improve Spawn's extension development experience.
4.2 Spawn Core
The previous subsection revealed an extension system that allows for generating highly-expressive and realistic test data in a convenient fashion. This subsection will summarize the components in Spawn Core that powers the expressive capabilities observed in Spawn's FVGs.
4.2.1 Graph Model
Data across a single row is always generated from left to right. Data down a single column is generally generated from top to bottom. (FOOTNOTE: exceptions only occur in parallel computation models) How about data across different tables?
The Graph Model dictates the order by which data is generated across different
tables in the schema. It powers the foreignData input available in FVGs. More
details will be explained in (Section 5).
4.2.2 Random Number Generator(RNG)
Spawn's RNG is implemented using the PCG-XSH-RR RNG which belongs to the
permuted congruential generator (PCG) family of random number generators
[O'Neill, 2014]. It was selected for the following reasons:
-
Seeded - allows for identical RNG sequences to be generated across different runs
- able to generate Identical datasets for benchmarking
- Fast - Generates next state at a very low constant cost
-
Logarithmic access times - able to jump ahead to the $n_{th}$ number in the RNG sequence in $log(n)$ time.
- Algorithm developed by [Brown et al, 1994]
-
High periodicity - A period of $2^n$ where $n$ is the number of bits used to store the state.
- Spawn utilizes a good multiplier constant proposed by [L'ecuyer, 1999] to ensure good lattice structure.
- Spawn uses a 64-bit implementation.
By abstracting the task of generating random numbers out into a self-contained function, Spawn allows FVGs to generate random data while staying pure.
4.2.3 Postprocessor
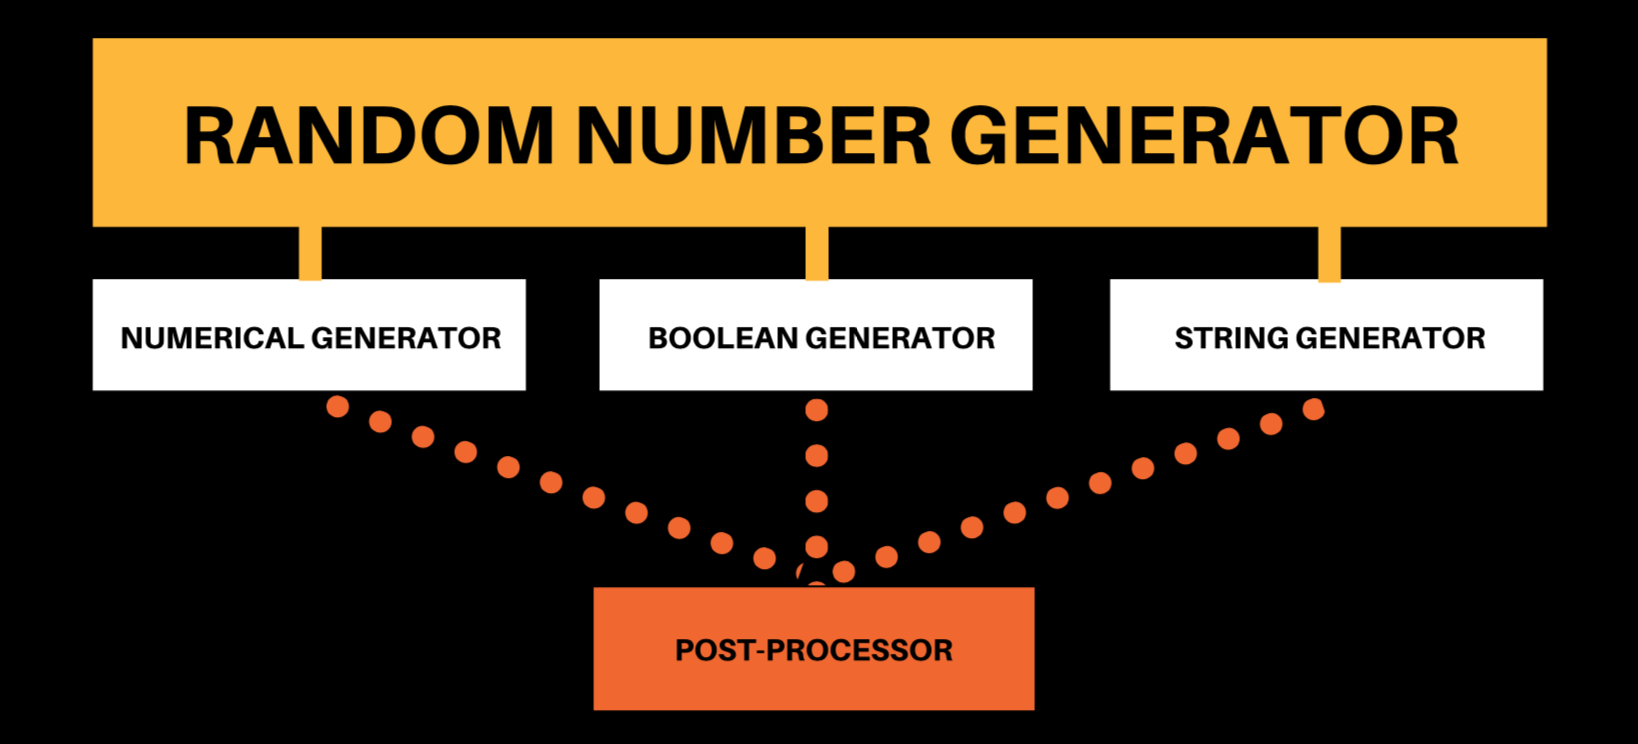
Data generated by an FVG can be optionally fed into a post-processor which performs a final alteration to the generated data. The post-processing step allows FVGs to be more versatile and encourages code reuse.
For instance, a floating point generator could be repurposed as an integer generator by providing a post-processor that rounds floating point outputs to its nearest integer.
A email string generator could be repurposed as an email domain name generator by allowing developers to specify their custom regex to pull out the domain name.
4.2.4 Data Log
The data log is simply a temporary flat file that stores all the generated data
before it is ready to be exported by Spawn. While it is a simple concept, it is
extremely powerful. The data log is what affords FVGs the rowData and lastN
inputs.
4.2.5 Configurations management
Each data generator project contains complex configurations that Spawn will need to persist across different sessions. Hence, Spawn uses an XML file to store all of the configurations that describes a data generator project. This enables configurations to be saved, loaded, and shared between computers. It also affords Spawn the option of adopting a client-server architecture in the future.
A client-server architecture will allow Spawn to:
- Capitalize on the multiple cores available on servers to generate data in parallel.
- Enjoy performance benefits by employing systems level language such as Golang or C++ to generate data on the backend. Generating data on the frontend is limited by Javascript's relatively poorer performance.
Spawn's configurations management file is similar to the meta-generators proposed by [Rabl et al, 2013].
4.2.6 Database interface
The database interface controls how Spawn communicates with the databases Spawn generates data for. As Spawn is developed using Javascript, Spawn will capitalize on the robust Sequelize ORM to perform its database transactions.
5. Spawn: Graph model
Spawn utilizes a graph model to determine the data generation priority between tables. Steps 1-3 detail how the graph model is produced while steps 4-7 detail how the graph model is used in determining data generation priority.
- Each table is modelled by a node
- If a table (T1) is generated based on data available in another table (T2), we call T1 a consumer of T2's data. A consumer relationship is modelled by a directed edge originating from the consumer and pointing towards the producer.
- Spawn prevent the formation of any closed cycles in the graph model. This prevents cyclic data dependencies.
- When it is time to generate data, generate any table with no outgoing directed edge (Non-consumer). The prevention of closed cycles in step 3 guarantees that there is at least one Non-consumer table.
- Repeat step 4 until there are no more Non-consumer tables.
- Generate a consumer table that only consume fully generated producers.
- Repeat step 6 until there are no more tables to be generated.
<WILL INCLUDE: Figures 5a and 5b illustrates a database schema and its associated graph model.>
Spawn's graph model borrows its design from the graph models proposed by [Bruno & Chaudhari, 2005] and [Houkjaer et al, 2006]. Table 5a details where the three models converge and diverge.
Table 5a
| Houkjaer et al, 2006 | Bruno & Chaudhari, 2005 | Spawn | |
|---|---|---|---|
| Priority | Determines data generation priority between tables | Determines data generation priority between tables and columns | Determines data generation priority between tables |
| Nodes | Nodes carry table data | Nodes carry table data | Nodes carry table data |
| Edges | Three types of directed edges | One type of directed edge | One type of directed edge |
| Edge data | Edges carry information on foreign keys and cardinality distributions | Edges carry no information | Edges carry information on foreign keys and cardinality distributions |
6. Graphical design
Spawn's GUI attempts to make the task of configuring data generators as simple as possible. The GUI is written in Electron, and powered using the React frontend library.
6.1 Overall layout
Figure 6a: Spawn's GUI's overall layout
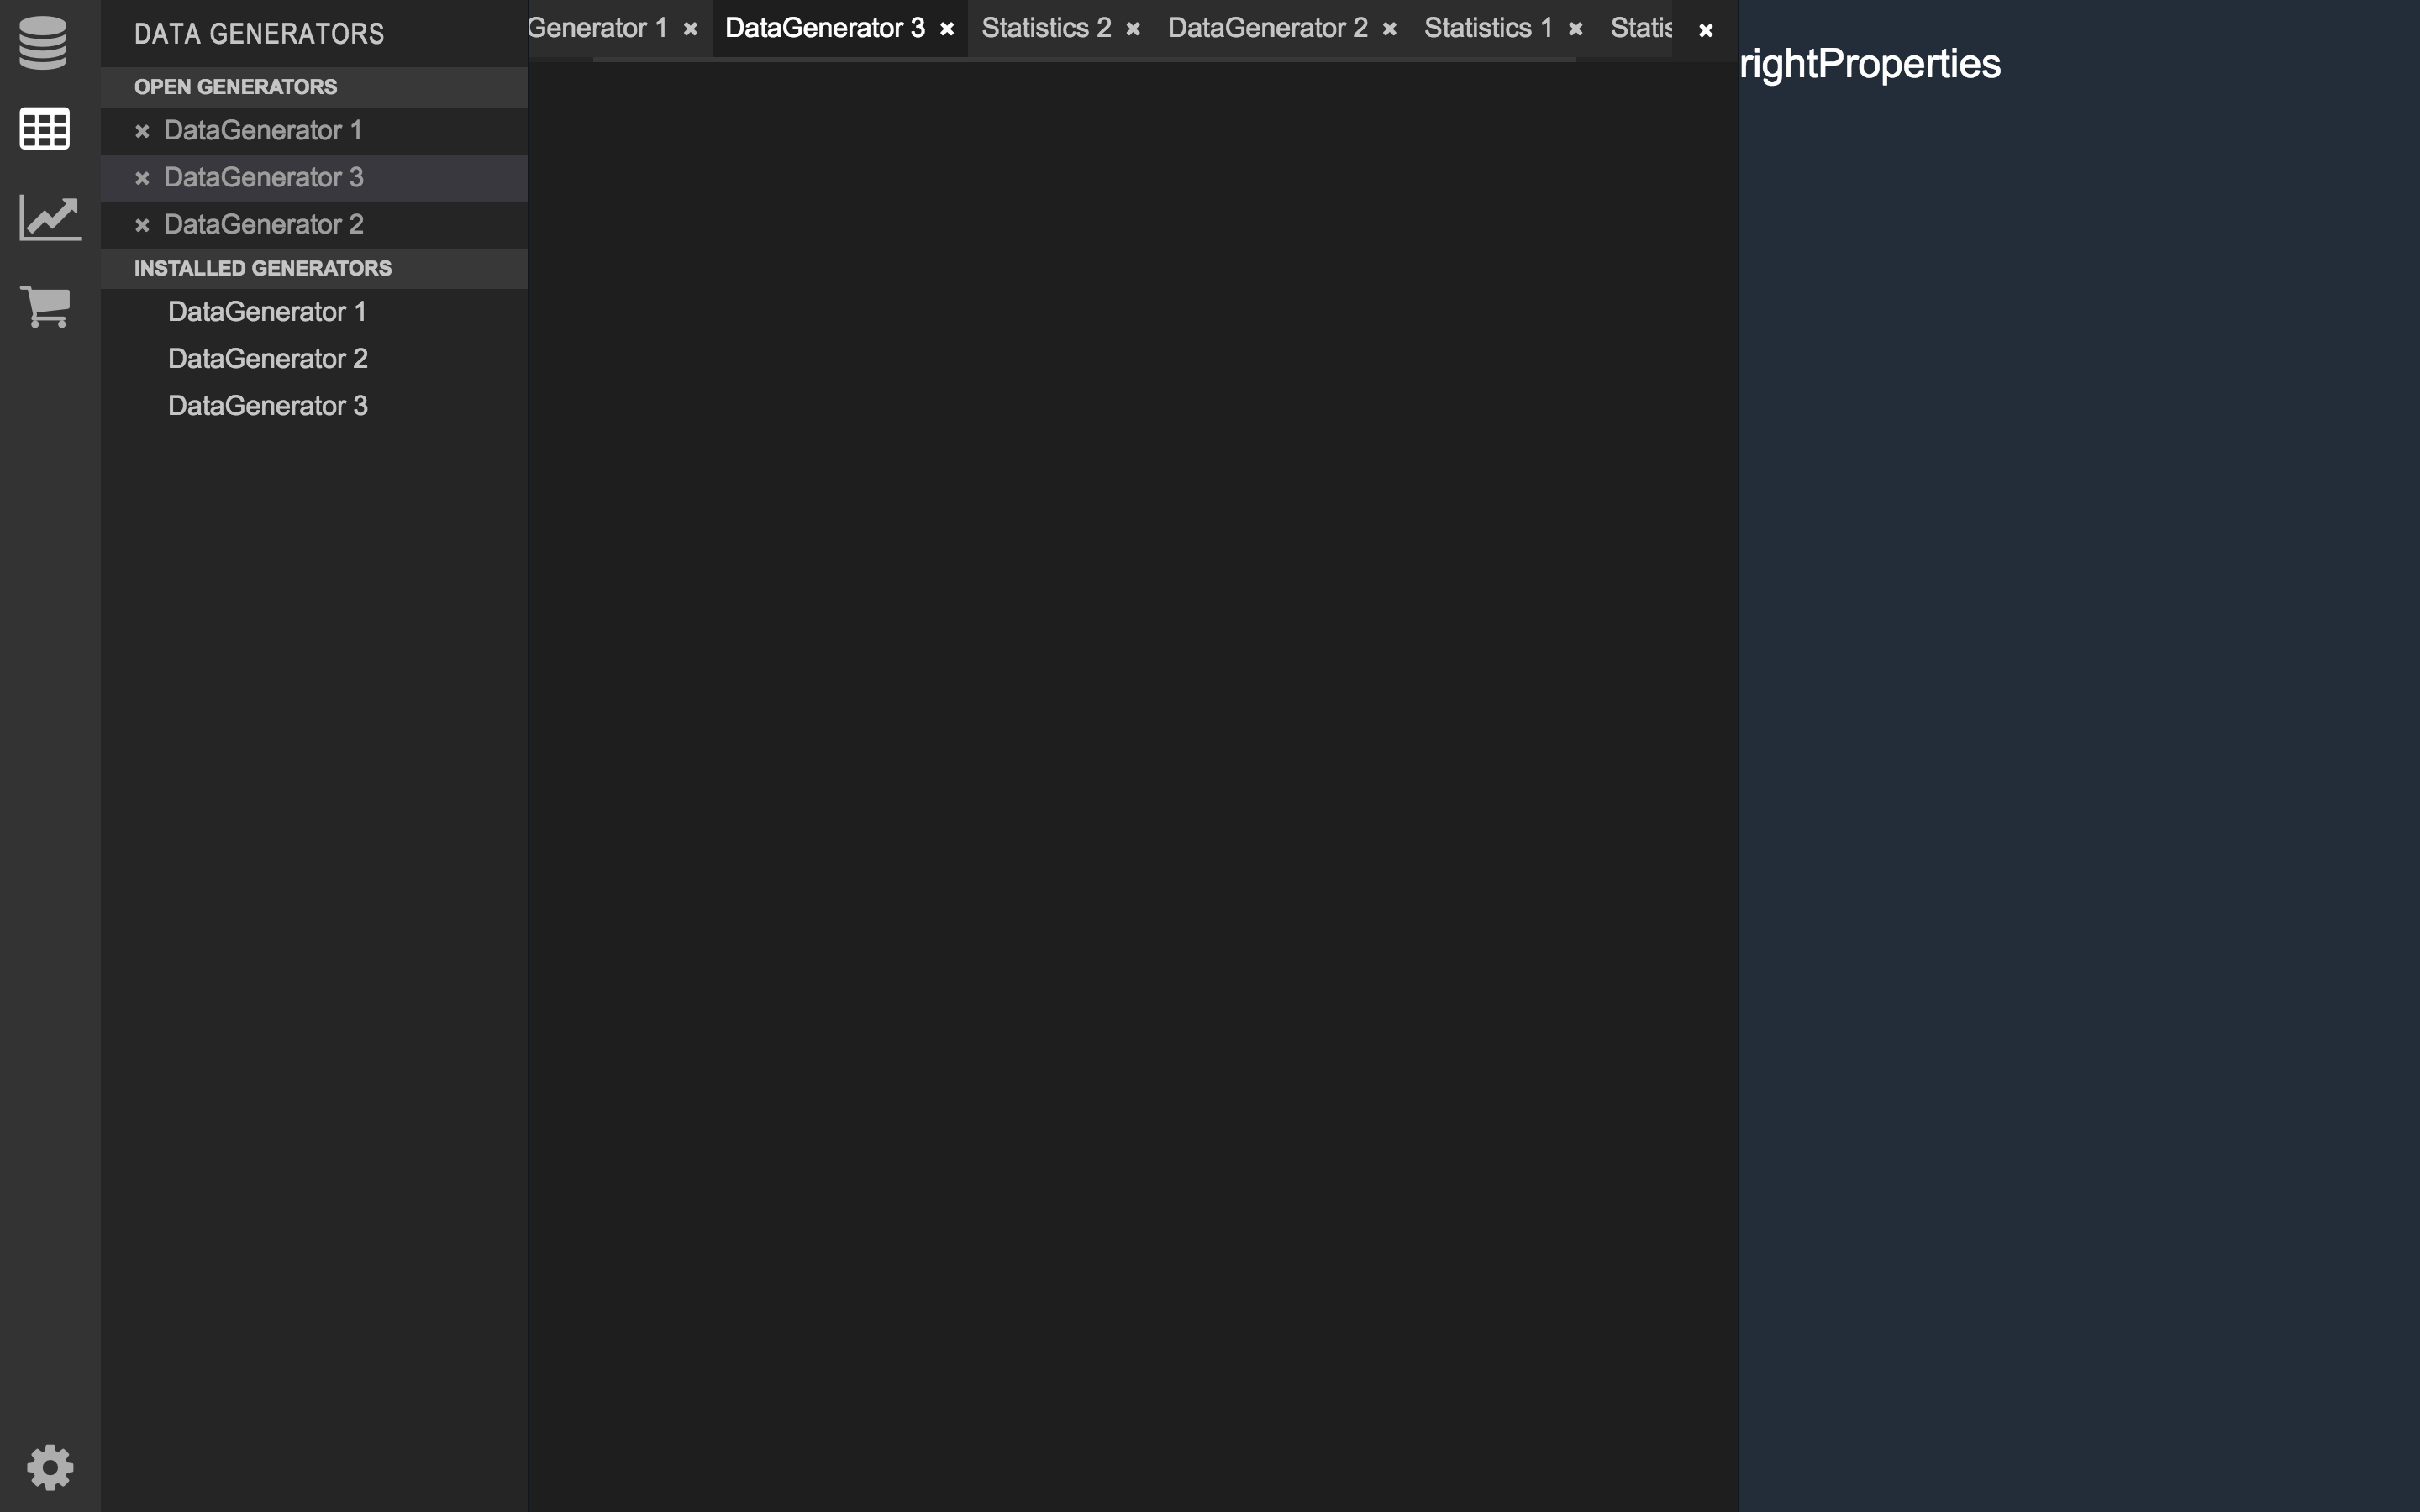
The GUI consists of four main components listed from left to right:
-
The Navigation Bar is the leftmost graphical component. It allows users to switch between various task categories quickly. The navigation bar is laid out vertically along the left instead of horizontally along the top to conserve the scarce vertical real-estate of the landscape view. The following task categories are listed on the navigation bar.
- Schema - Allows users to configure their database schema through a graphical interface.
- Graph - Allows users to visually inspect how their database's graph model looks like.
- FVGs - One category for each type of FVG. Allows users to test different FVGs before incorporating them into their data generator.
- Extension store - Where users are able to browse and install FVGs developed by other users.
- Settings - Where users are able to deal with Spawn's configuration.
- The Category Explorer allows users to navigate effectively within a category.
- The Main Editor takes centrestage in Spawn's GUI. The tabs located at the top of the main editor allow users to quickly navigate between the various tabs they have open on Spawn. The Panes below the tabs are where majority of the visualizations offered by Spawn are rendered.
- The Properties Explorer is where most of the configurations are managed.
6.2 Specific visualizations
While the GUI has not been fully developed, this subsection will detail how Spawn's GUI will look like on a category level.
6.2.1 Schema Visualization
Figure 6b: A design inspiration for how Spawn's schema category could look like

The schema visualization tab will allow developers to configure their database model based on a graphical user interface. Clicking any of the tables in the Main Editor will populate a different view on the Properties Explorer where configurations for the specific table will be managed.
6.2.2 Graph Visualization
The graph visualization tab offers a view similar to the Schema visualization tab with a few key differences:
- Tables are replaced by nodes
- Relations are replaced by directed edges
- Data Generation details are configured in place of the database model.
6.2.3 Boolean Visualization
The Boolean visualization tab displays a simple pie chart in the Main Editor to visualize the percentage of true and false booleans generated by a specific Boolean FVG under certain input conditions. The GUI runs the Boolean FVG ten thousand times to generate a representative sample. The input details are configured on the Properties Explorer.
For instance, a Boolean FVG that takes in an individual's "Country" as an input to generate the likelihood of the individual being retired is going to show different pie chart if "China" is keyed in as opposed to "Japan".
6.2.4 Numerical Visualization
The Numerical Visualization tab displays two graphs on the main canvas for users to visualize output of a specific Numerical FVG: a cumulative distribution function (CDF) and a probability density function (PDF) of the Numerical FVG. Similar to the Boolean Visualization, the GUI runs the Numerical FVG ten thousand times to generate a representative sample that it then uses to plot the CDF and PDF graphs. The FVG's inputs are also configured in the Properties Explorer.
6.2.5 String Visualization
The String Visualization tab displays two items on the main canvas for users to visualize the output of a specific String FVG: a stringcloud, and a string frequency list generated by the String FVG. Similar to the Boolean Visualization, the GUI runs the String FVG ten thousand times to generate a representative sample that it then uses to form the string frequency list and stringcloud.
6.2.6 Datetime Visualization
The main canvas displays several charts that users are able to switch between:
- Line graph of time series data
- Pie chart by Hour of day
- Pie chart by Day of week
- Pie chart by Month
- Pie chart by Year
7. Generating data quickly
CDG generates batches of data one field at a time to maximize the cache hits on the CPU's Translation Lookaside Buffer (TLB) for hardware optimization.
When generating data within a record, CDG simply retrieves the required input fields (recently generated) from the memory.
When generating data across associations, CDG opts to generating a local copy of the parent record instead of pulling the data from the database. Generating a local record is faster than seeking for information through a network given that the PRNG used in CDG is able to generate the nth random number in the RNG sequence within log (n) time.
8. Comparison
9. Academic References
9.1 Data Generators
-
Quickly generating billion-record synthetic databases - 333 citations, 1994, Gray et al
- Father of all Data gen papers. Abit old, talk alot about OS, but addresses key concerns regarding how to generate data in a parallel fashion with a shared-nothing architecture.
-
New TPC Benchmarks for Decision Support and Web Commerce - x citations, 2000, Poess and Floyd
- Introduces a couple of TPC benchmarks
-
MUDD: A Multi-Dimensional Data Generator - 24 citations, 2004, Stephens & Poess
- Provides history of data generators
-
Flexible Database Generators - 40 citations, 2005, Bruno & Chaudhuri
- Introduces Data Generation Language(DGL) a domain specific language for data generation.
- Argues for data generation to follow a Direct Acyclic Graph, eg. if firstName data, depends on lastName data, lastName cannot depend on firstName data.
-
Simple and realistic data generation - 38 citations, 2006, Houkjaer et al
- Introduces a new data generation tool, its architecture, and graph model.
- Inter-row dependencies also exist, like uber's polling of driver location.
-
A Data Generator for Cloud-Scale Benchmarking - 21 citations, 2010, Rabl et al
- Introduces an ubiquitous parallel data generation framework (PDGF) that is suitable for cloud scale data generation.
-
Data generation using declarative constraints - 14 citations, 2011, Arasu et al
- Argues that cardinality constraints are a natural, expressive, and declarative mechanism for specifying data characteristics.
- Discusses how Linear Programming (LP) solvers can be used in conjunction with cardinality constraints for natural (user-friendly) data generation.
-
Myriad: scalable and expressive data generation - 21 citations, 2012, Alexandrov et al
- Introduces Pseudo-Random Data Generation (PDRG) an algorithm that improves upon PDGF's SeedSkip algorithm to generate data more optimally.
- Leverages random access of the produced pseudo-random number sequence to optimize data generation.
-
Reversing statistics for scalable test databases generation - 2 citations, 2013, Shen & Antova
- Proposes RSGEN a data generation algorithm that leverages a source database's metadata to generate a scaled-up version. (only handles numerical data)
-
Rapid development of data generators using meta generators in PDGF - 2 citations, 2013, Rabl et al
- Proposes the use of an XML based meta-generator that can be parsed to deterministically generate identical data.
-
Just can't get enough: Synthesizing Big Data - 3 citations, 2015, Rabl et al
- Introduces DBSynth, an improvement upon RSGEN that is able to handle more than numerical data.
9.2 Random Number Generation
-
- Introduces the Permuted Congruential Generator(PCG) family of RNG algorithms
- based off the Linear Congruential Generator (LCG) algorithm.
-
- Provides good multiplicative constants to be used with the LCG algorithm.
-
Random Number Generation with Arbitrary Strides - 9 citations, 1994, Brown et al
- Provides a formula to retrieve the nth number of an LCG sequence in log(n) time.